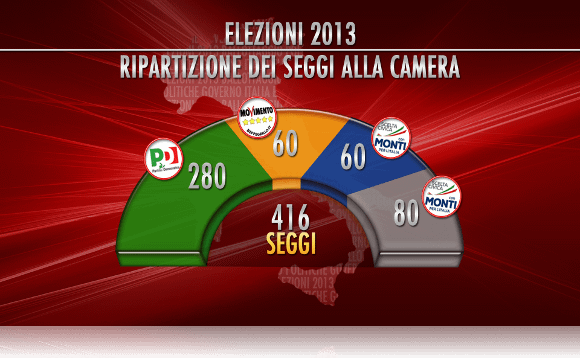
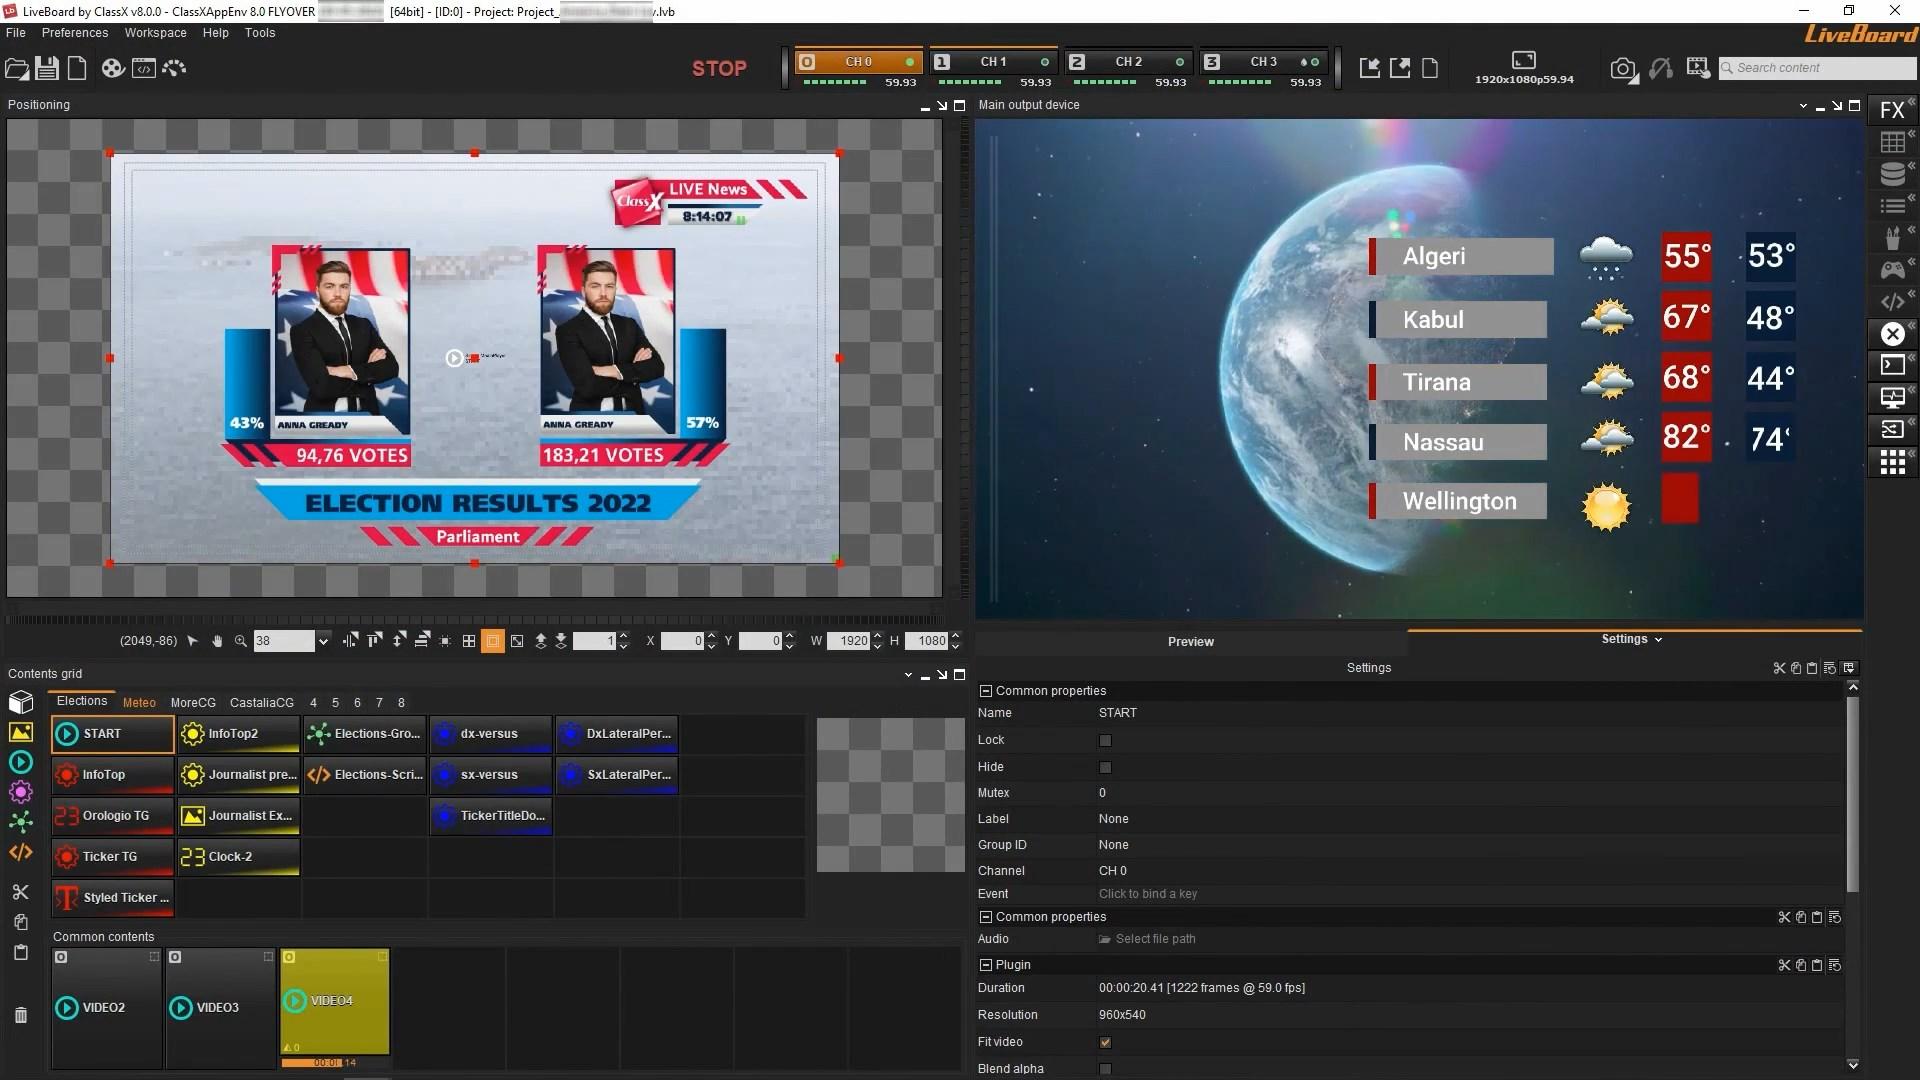
Wherever you get your data from, you have all the tools you can imagine to show these data in appealing, dynamic graphics.
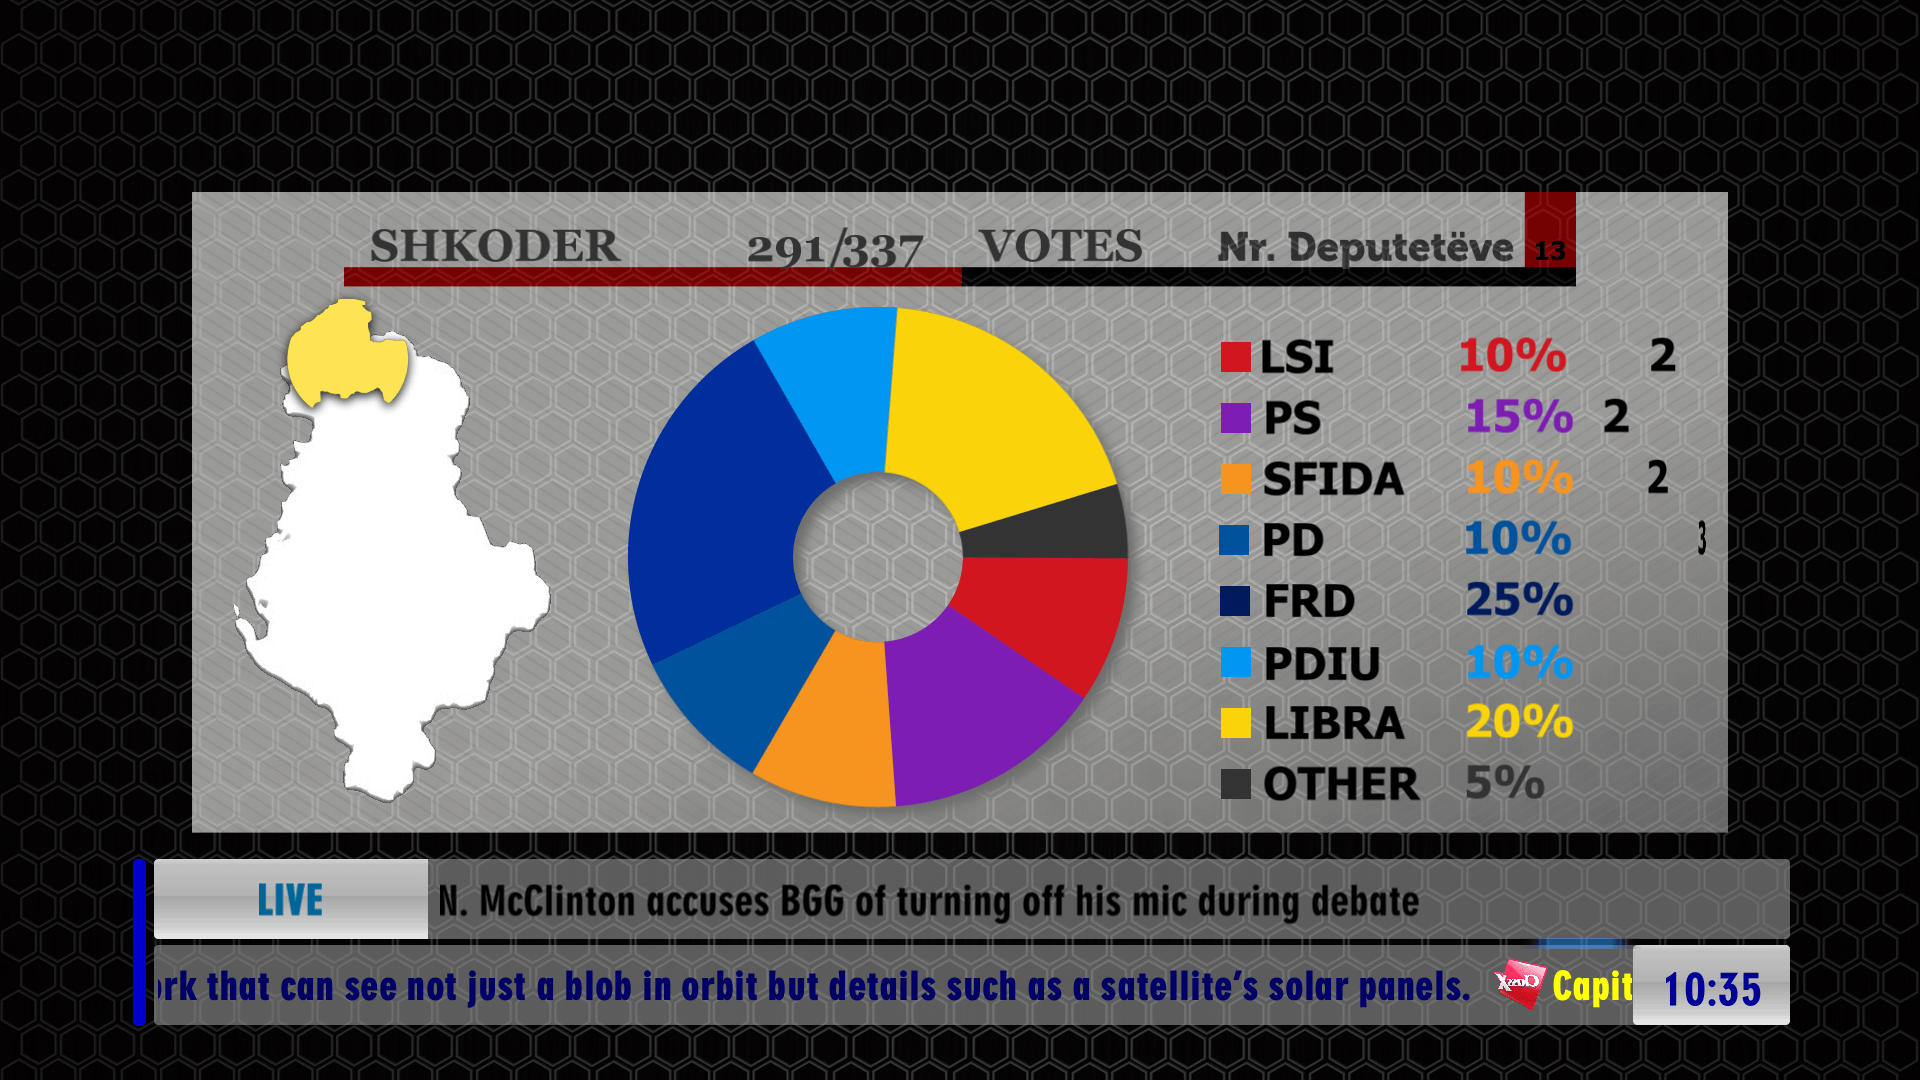
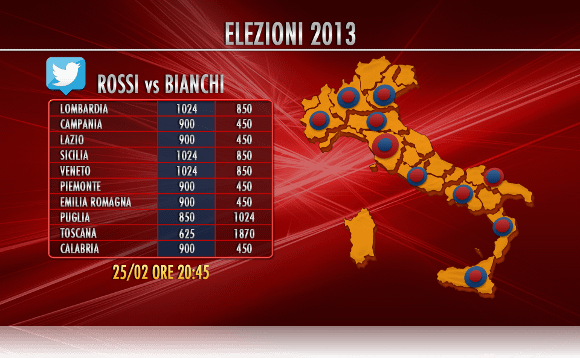
Your live show can be constantly up-to date thanks to the smart data-driven plugins of LiveBoard. Vertical, horizontal or even Styled Ticker, supporting images and videos.
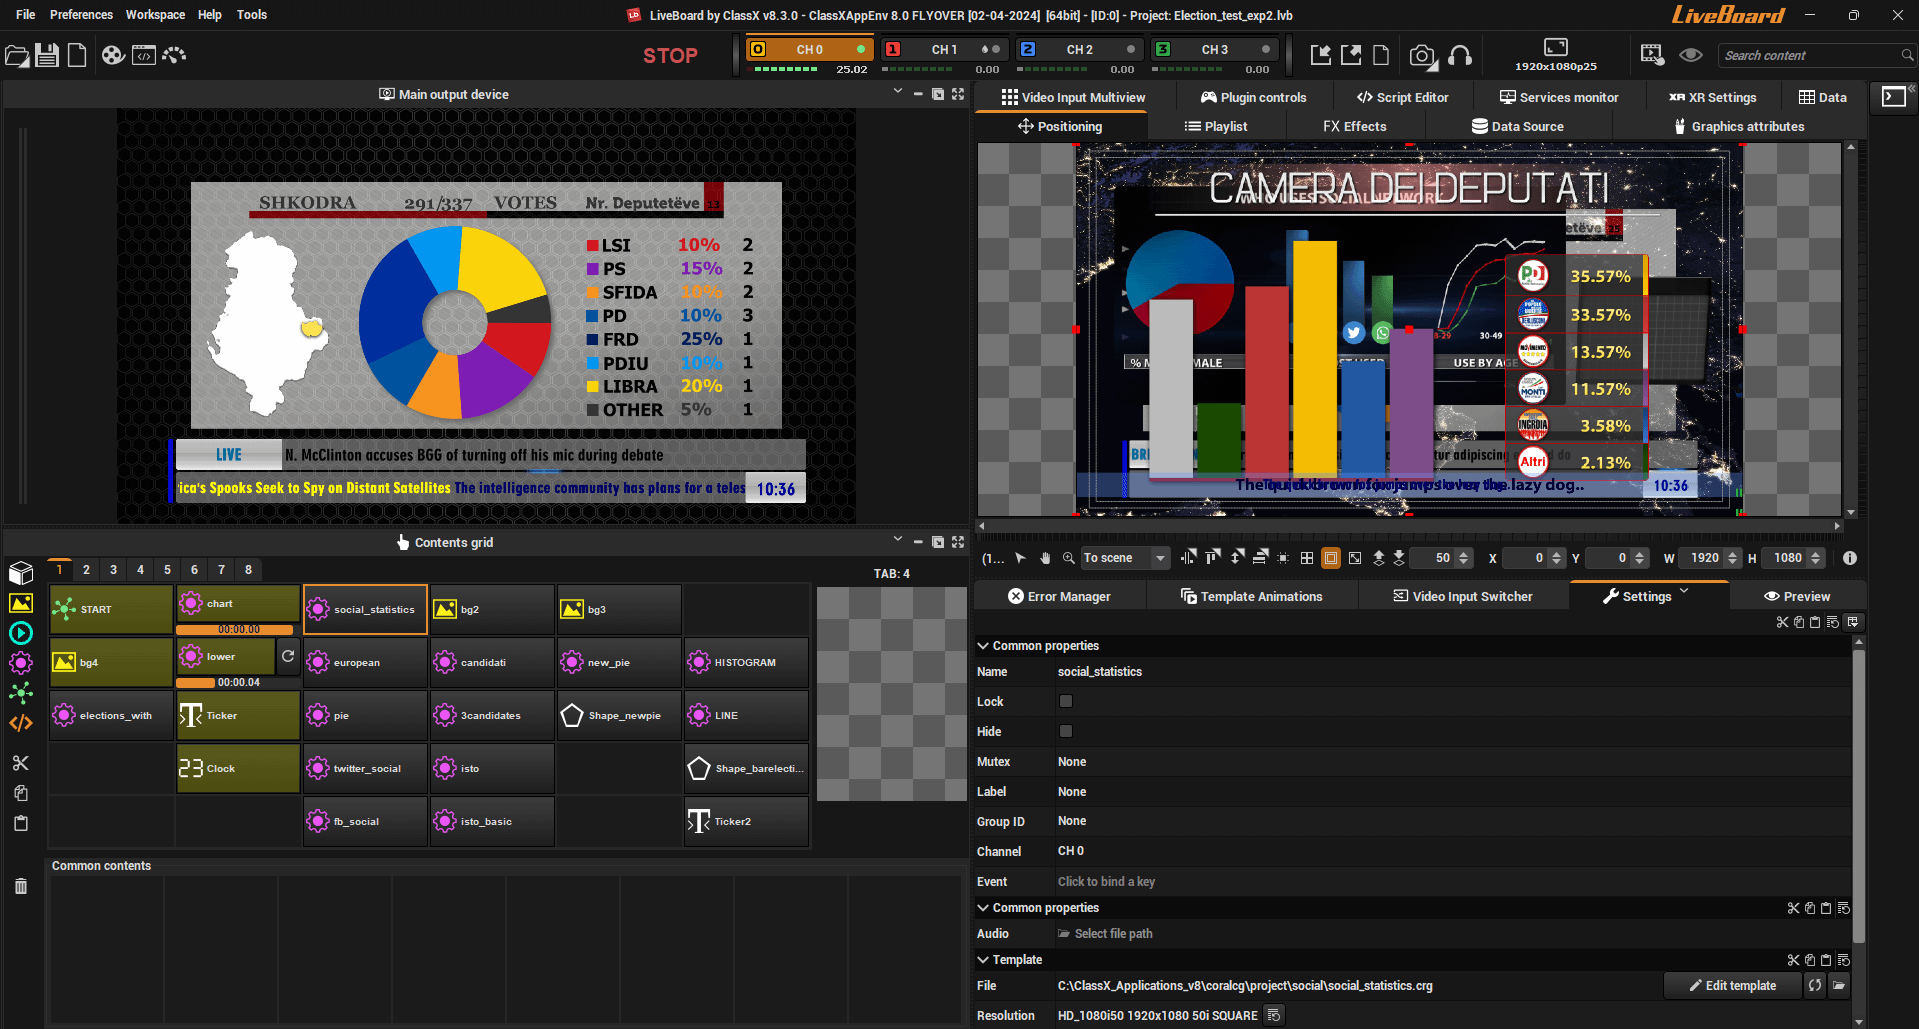
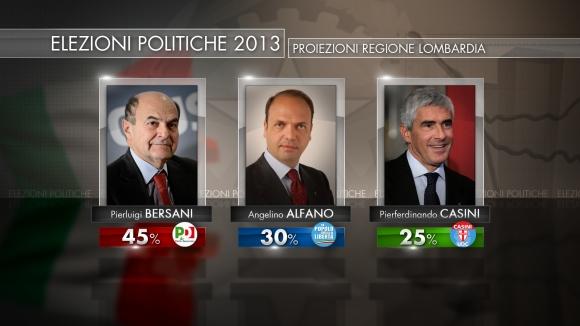
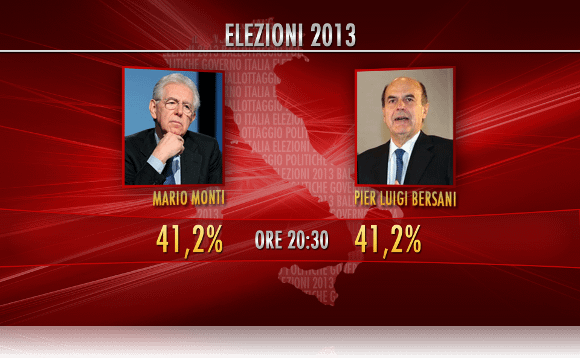
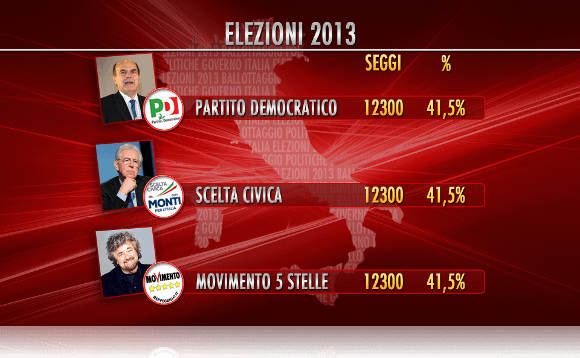
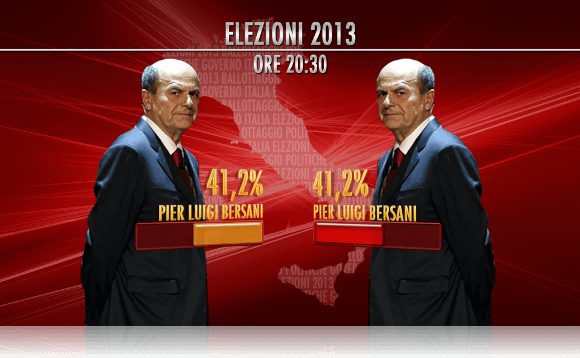
LiveBoard is your ally in playing out any sort of data you need to show as live graphics. For elections, xlsx is quite often the preferred data source format: ClassX DataSource Editor allows to link a cell content to a chart object.